I design cloud solutions for connected products. Data collection is the part I think about most at work. So it was a bad surprise to find that my own telemetry stack had collected nothing for five months.
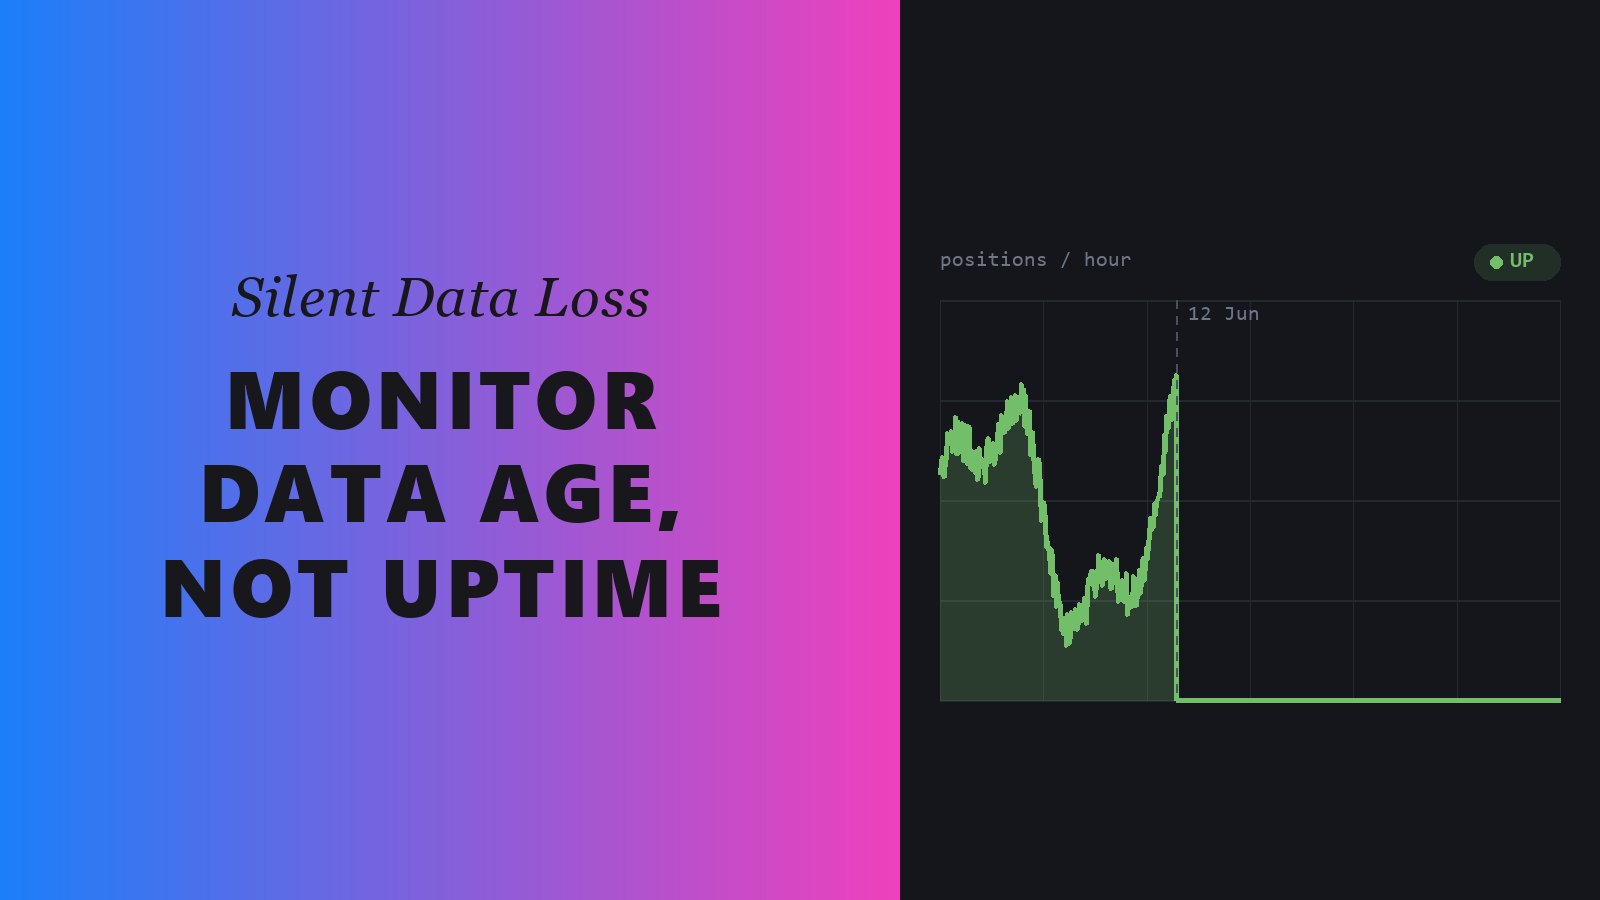
Nothing looked broken. The containers were up. The web interface answered. Grafana drew its graphs. The database had not received a new row since 12 June.
In this article I’ll explain how a stack stays healthy and idle at the same time, why none of my checks caught it, and what I check now.
The setup
I self-host TeslaMate, an open source logger for Tesla cars. It polls the car’s API and stores drives, charges and positions. It runs in Docker on a small VPS: the app, a PostgreSQL database, an MQTT broker, and Grafana for the dashboards. It had been collecting since March without a problem.
How I found out
Not from an alert. I found it in November, by running a query I should have put on a schedule in March:
select max(date) from positions;
The answer came back as 12 June. Almost five months of driving, none of it recorded.
Trap 1: :latest does not update anything
My compose file asked for the :latest image. I had assumed that meant I was current. It does not.
A tag is resolved once, when you pull. After that, docker compose up -d starts the image already on disk. It does not check whether a newer one was published. My container was still running version 3.0.0, pulled in March, with a tag that said latest all along.
To actually move, you need the pull to be explicit:
docker compose pull
docker compose up -d
So :latest gave me no benefit at all. I was not getting new versions, and I did not know which version I was running.
Trap 2: the logs were right and I read them wrong
Version 3.0.0 shipped with Erlang/OTP 26. Its TLS stack led Tesla’s authentication server to return a Fleet-scoped token when the old one was refreshed. The legacy owner API then refused that token. Here is what the log looked like:
POST auth.tesla.com/oauth2/v3/token -> 200
Refreshed api tokens
GET owner-api.teslamotors.com/api/1/products -> 403
forbidden, see https://developer.tesla.com/docs/fleet-api
Read that again, because it fooled me for a while. Authentication succeeded. The account was fine and the password was fine. The 403 came one call later.
That link in the error is the trap. Tesla returns the same message to business fleet accounts that have to migrate to the new Fleet API. So I started looking at a developer account, a client ID, an API host variable, and public hosting for the callback. That is a weekend of work. None of it was needed.
The fix was a version upgrade. Version 4.0.0 contains the correction, and I went to 4.4.0. About fifteen migrations ran in two seconds. The online state that had stayed open since June was finally closed, and the API started answering :offline for a sleeping car instead of :unknown for a failed call. Three drives were recorded end to end that same evening.
The lesson from this one: check the version you are actually running before you believe what an error message tells you to do.
Trap 3: running is not the same as recording
This is the part that matters, and the reason I wrote this article.
Every signal I was watching answered the wrong question:
- A container marked Up means the process did not exit.
- A 200 on the web interface means the web server works.
- A Grafana panel with a line on it means the query ran and found rows.
Not one of them says that a new row was written. My stack was running. It just was not recording anything, and running was the only thing I had ever checked.
A health check asks is it running. For anything that collects data, the useful question is when did it last save something. The two questions sound alike. For five months, they had different answers.
So the check is now on the age of the newest row, not on the state of the process. One query, compared against a threshold:
select (now() at time zone 'utc') - max(date) as data_age from positions;
TeslaMate declares that column as :utc_datetime_usec, which Ecto stores as a timestamp with no time zone. The values are UTC, so the comparison has to be against UTC too. A plain now() would be off by your server’s offset.
There is a problem with this, and it decides whether the alert is useful or not. Data age alone cannot tell the difference between a broken collector and a car that was parked for a week. Both of them record nothing.
So the age is the second check, not the first. The first one reads the log. A refusal from the Tesla API is exactly what this failure looks like, and a parked car never causes one. The age check comes after it, with a long threshold, for the problems the log does not show.
It also looks at three tables instead of one, because a parked car still writes states even when it records no positions.
The log is a better source than the state the app records, which surprised me. An unknown state sounds like the perfect signal for a failed call. But it happens about six times a day when everything works, so it would only raise false alarms.
I almost set the long threshold by guessing. I thought thirty-six hours was long enough for a car that gets driven most days. Then I measured. There were three gaps longer than that in normal use: 38.0 hours, 67.8 hours, and 101.7 hours. A 36 hour threshold would have sent three false alarms before it caught a real problem. After three false alarms, nobody reads the fourth message.
Here is the full measurement, across 901,948 gaps between records from before the failure: 99 percent are under a minute, and the longest is that 101.7 hours. So the data normally arrives without stopping, apart from a few long gaps. I set the threshold at 120 hours, above the longest gap I have ever had.
Trap 4: an empty dashboard is not an empty database
One more trap, right after the upgrade, because this one is easy to panic about.
All my Grafana dashboards came back empty. Not just the recent data, the old data too. Months of history gone from every panel. Meanwhile the database held 396 drives and 1.2 million positions, all still there.
The cause was a NULL in the name column of the cars table. Fourteen of the dashboards shipped with the image build their car selector like this:
SELECT name AS __text, id AS __value FROM cars ORDER BY display_priority ASC, name ASC
With no name, the dropdown entry is blank, the $car_id variable never resolves, and every panel filtered on that variable returns nothing. Other dashboards in the same image use COALESCE(name, CONCAT('VIN ', vin)) and kept working normally. If some screens work and others are empty, this is usually the difference.
Naming the car brought everything back. Do it in the Tesla app rather than in the database: TeslaMate reads that field from the car’s display_name, so a direct update gets overwritten on the next sync. The point worth keeping: an empty dashboard looks exactly like lost data, and lost data makes you want to restore a backup. There was nothing to restore here. Count the rows in the database before you conclude anything from a chart.
What I changed
A freshness check instead of a health check. A script on a timer, every six hours. It watches five things on their own: collection, backup, certificate, disk and version. It sends me a message when one of them breaks, and another when it works again. In between, a reminder every seven days. For the version, the reminder comes every thirty days instead, because a missing update is less urgent than a broken collector. The five states are separate on purpose. Share one state and a disk warning would hide a collection failure, because the script would already be in alert and would stay quiet.
The alert goes to my phone, not to a file. The backup used to write its result to a file on the server. That is the same mistake again: the file only helps someone who goes and reads it. The check sends to Telegram instead, so a failure reaches me in a week when I never open the dashboard.
The check is checked too. The check and the backup both have an OnFailure= handler that sends the same alert if they do not run at all. If the check itself stops working, I hear nothing, exactly as before.
Pinned versions, and a check for new ones. No more :latest, and the backup records the exact image tags so I know what to go back to. But pinning a version only keeps the June situation in place, so the check also compares the version I run against the latest release on GitHub. It reads the version label from the image the container is running, not from teslamate/teslamate:latest. That difference matters: if you pull without recreating the container, the image on disk is newer than the one running, so the local tag gives the wrong answer. This is the check I wish I had had in March.
A daily backup that refuses a bad dump. A pg_dump that fails partway still leaves behind the part it already wrote. Piped into gzip, that gives a small archive which is perfectly valid and almost empty. A shell pipeline also reports the exit code of its last command, so the failure itself can pass unnoticed. So the script rejects any dump under 1 MB, verifies each archive after writing it, and leaves a one line status file I can read in a second. I also tested the failure path on purpose, to be sure it reports a failure instead of staying quiet.
One thing I have not fixed. That backup sits on the same machine it protects. It covers a bad upgrade and my own mistakes. It does nothing if I lose the server. There is no off-site copy yet, and I would rather write that down than pretend otherwise.
The takeaway
A failure that takes everything down gets noticed in minutes. A failure that keeps everything up and quietly stops the data can run for five months. The second kind is more common, and nothing in a default setup will tell you about it.
This is not really about Tesla logging. The same applies to an IoT pipeline, an ETL job, a webhook consumer, or a nightly batch. If the thing produces data, monitor the data.
If you run something that collects, go check the newest timestamp now. It takes ten seconds. I wish I had done it in July.